12/03/2024
With a growing global population, ensuring that food is efficiently utilized becomes a top priority to meeting the nutritional needs of people worldwide. In the meantime, food loss and food waste represent a significant challenge that can occur at various stages of the food supply chain, from production and postharvest handling to processing, distribution, and consumption. Advances in technology, such as Artificial Intelligence (AI) including deep learning and computer vision, are increasingly being used to monitor and manage food supply chains, identify areas of inefficiency, and reduce food loss. These technological innovations hold promise for improving food security and sustainability. However, when developing such algorithms, data play a fundamental role as those approaches rely on large amounts of labeled images or videos to learn to address the desired task. Here, we present the first results of the work that has been done during the winter 2023-2024 by Dilepix in the FOLOU project.
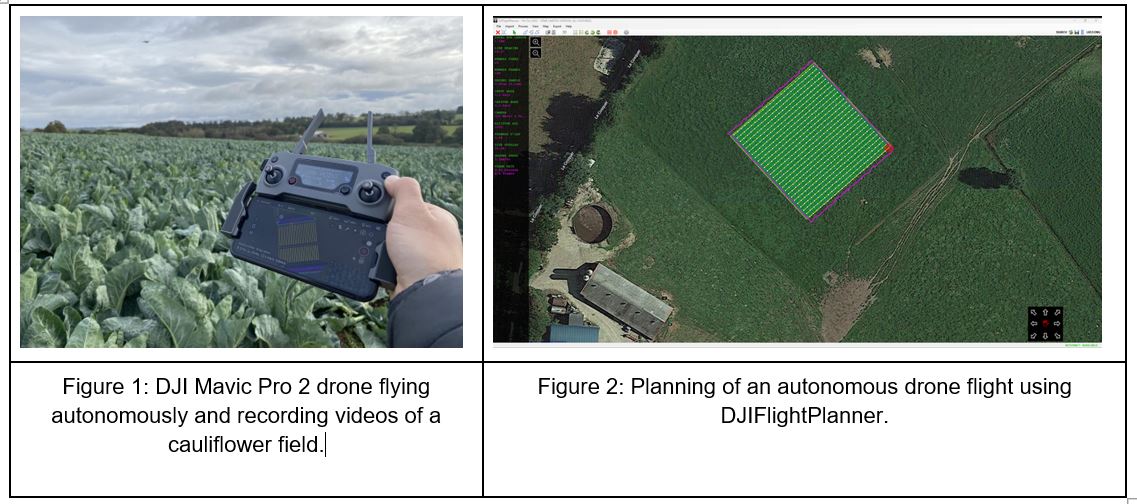
In Brittany, France, winter also represents a peak of cauliflower harvesting, which has been chosen this year to tackle the problem of food loss. We performed multiple data acquisitions over three different fields between mid-October and mid-November, going from pre-harvesting (about 2 to 3 weeks before harvesting) to post-harvesting. The fields were harvested several times, leading to partially harvested field acquisitions. Data, videos in our case, were recorded using a drone flying at low altitude to also simulate that the camera could be placed on a tractor.
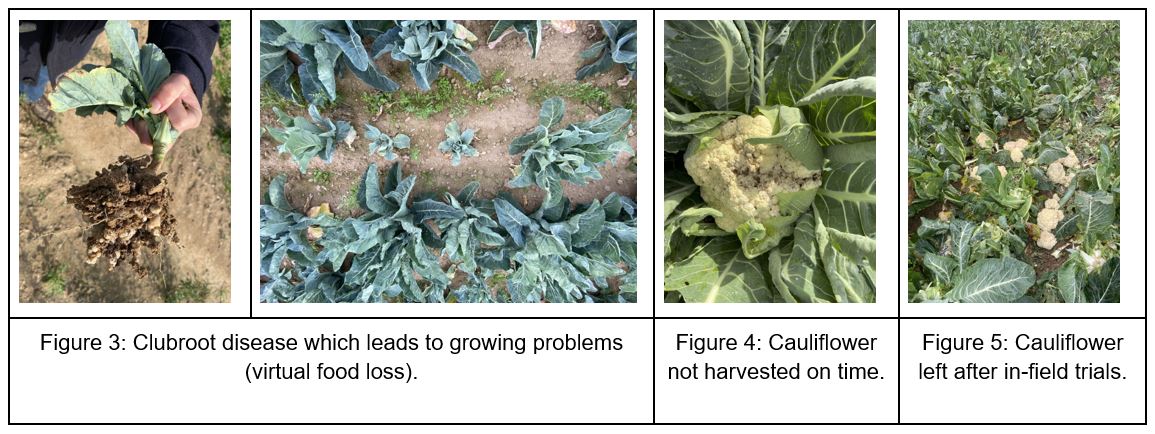
Depending on the stage of the food supply chain we consider, food loss takes different definitions. In pre-harvesting, the focus will be made on virtual or potential food loss. These losses can be, for example, represented by an expected lack of productivity due to plant diseases. On the other hand, during harvesting or post-harvesting, the focus is more on direct food loss, such as vegetables not harvested on time or left on the field. Targeted fields have also been chosen due to the fact they were covering all those aspects.
Once data are acquired, their preparation is a critical step in the development of deep learning computer vision algorithms, involving the annotation of images and videos with relevant labels or tags. For this task, we have used Dilepix internal annotation tool. Labeled data were then utilized to train neural networks to detect cauliflowers individually and, based on their size, the homogeneity of the fields was computed.
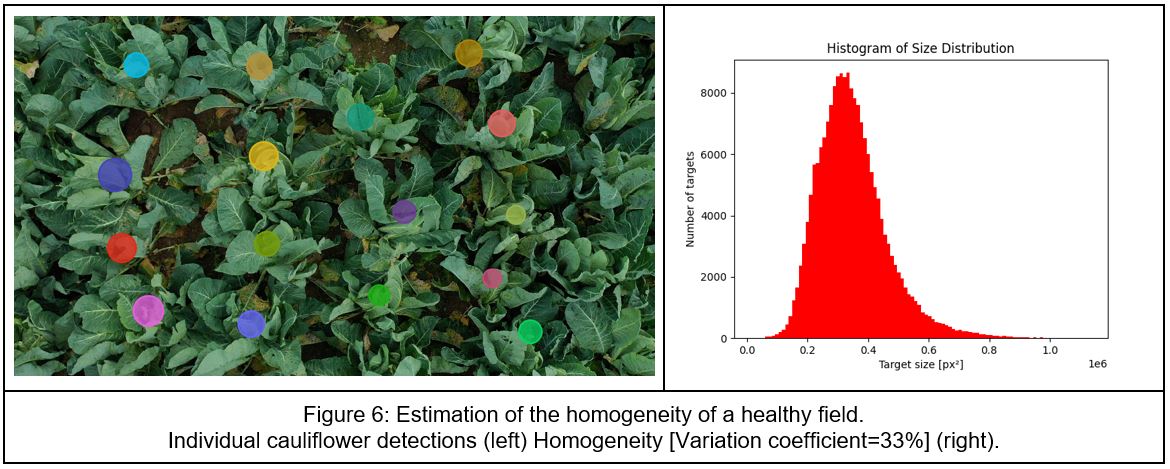
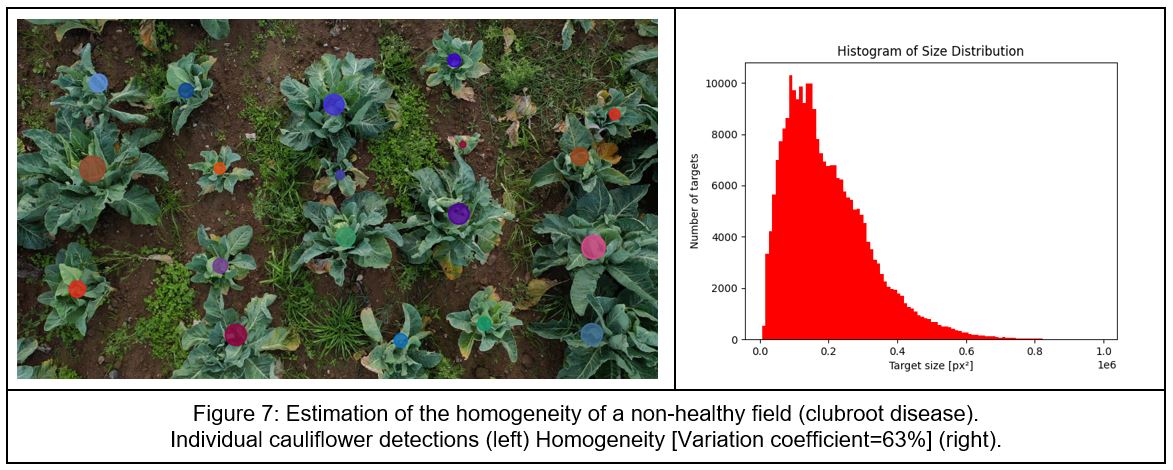
Homogeneity has been computed with the variation coefficient which is a statistical measurement of the degree of variability or inequality within a data series. It appears clearly a healthy field (Figure 6) is much more homogenous than a field affected with a plant disease (Figure 7). Its variation coefficient is 33% against 63% for a non-healthy field.
Our next step will be to link visual homogeneity to virtual food loss. One way to solve the problem is to generate a cartography of the homogeneity of the field. With this cartography in hand, we will compute which percentage of the field performs normally and based on its potential productivity, we can estimate virtual food loss. In addition, we will define additional vision-based measurements to address aspects such as germination, surface covered, anomaly detection,… Accurately measuring both virtual and direct food losses remains a significant challenge, yet leveraging innovative technologies such as AI and computer vision can be instrumental in attaining this objective!

This project has received funding from the European Union’s Horizon Europe research and innovation program, under Grant Agreement: 101084106. Views and opinions expressed are however those of the authors only and do not necessarily reflect those of the European. Neither the European Union nor the granting authority can be held responsible for them.
FOLOU is a proud partner of the Biorefine Cluster Europe.


Copyrights © 2026 | Folou.eu Cookie & Privacy Policy Webdesign & Development by ALYS